Sequence Scanner

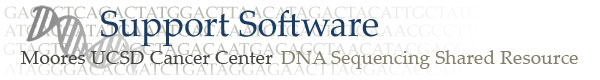
The free Sequence Scanner Software enables you to view, edit, print and export sequence data generated using the Applied Biosystems Genetic Analyzers. The software generates graphically expressive reports on results.
  • Review all traces in thumbnail format and sort them by trace quality.
  • View simultaneously the analyzed and raw trace data for a single trace.
  • Spot sample failures readily with reports such as the Plate Report.
  • Export traces into commonly used presentation formats (.jpeg, pdf).
When you import traces from one or more runs or plates into Sequence Scanner Software, you can quickly and easily switch between viewing all data in either a Details or Thumbnails View. Traces are sortable by multiple criteria, such as Average Signal Intensity, to give you easier access to your data. Use this feature to quickly identify any low quality or failed traces. Compare the signal intensities from one well to another using uniform Y scaling. Simultaneous display of Analyzed and Raw data Sequence Scanner Software delivers the much-anticipated feature of simultaneous display of analyzed and raw data, giving you the advantage of visually aligning analyzed trace to raw data. This way you can review low quality bases by matching the base calls the raw data. Sequence Scanner Software also gives you the ability to edit bases according to your expertise.

Peak Scanner

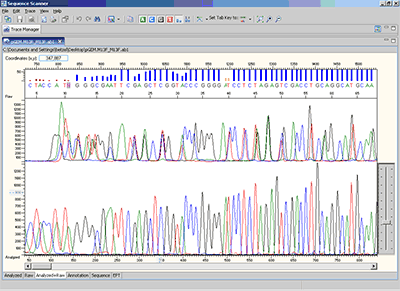
Use Peak Scanner to perform DNA fragment analysis; separate a mixture of DNA fragments according to their sizes, provide a profile of the separation, and precisely calculate the sizes of the fragments. The software allows you to view, edit, analyze, print, and export fragment analysis data generated using the Applied Biosystems Genetic Analyzers.

  • Use a workflow panel to guide you through analysis
  • Quickly analyze samples with the default sizing methods
  • View or print thumbnail and checkerboard view
  • View raw and analyzed data simultaneously
  • Analyze large fragments (e.g. 1200 bp)
  • Get better results with linear and non-linear sizing algorithms

The Peak Scanner Software will guide you through the process of fragment analysis. A clear interface and simple project archiving help make this tool the easiest way to perform DNA fragment analysis.

Peak Scanner is highly customizable. Thumbnail and checkerboard viewing and printing options are adjustable, as are the sample and sizing tables, locking and selective analysis, peak labeling, merging and splitting. You can even overlay sizing curves on analyzed data.

Convenient simultaneous viewing of raw and analyzed data is available in Peak Scanner, allowing you to size large fragments using either linear or non-linear sizing algorithms.


4Peaks

4Peaks is a free award winning trace file viewer for OSX 10.2 or later.

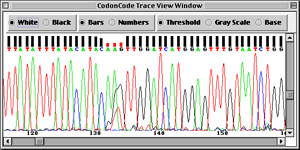
CodonCode TraceViewer

TraceViewer can be used to view .abi and .scf files on Mac OS X and Windows.

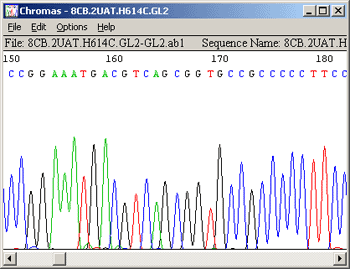
Chromas, Technelysium Pty Ltd.

Chromas is a minimalist program by Technelysium Pty Ltd. for use with Windows computers to view chromatograms.

Home  |  Events  |  Friends & Supporters  |  Faculty & Staff site |  Search

This site is a service of the Moores UCSD Cancer Center.  Comments or questions?  Please contact our webmaster.